
Route Analytics
See every bus. Fix what matters.
Route Analytics turns your bus GPS and student tap data into a clear picture of how your transport service really runs. Replay any trip in 3D, see which stops are in the wrong place, spot buses that run late or overloaded, and find the routes that need attention, all in one place.
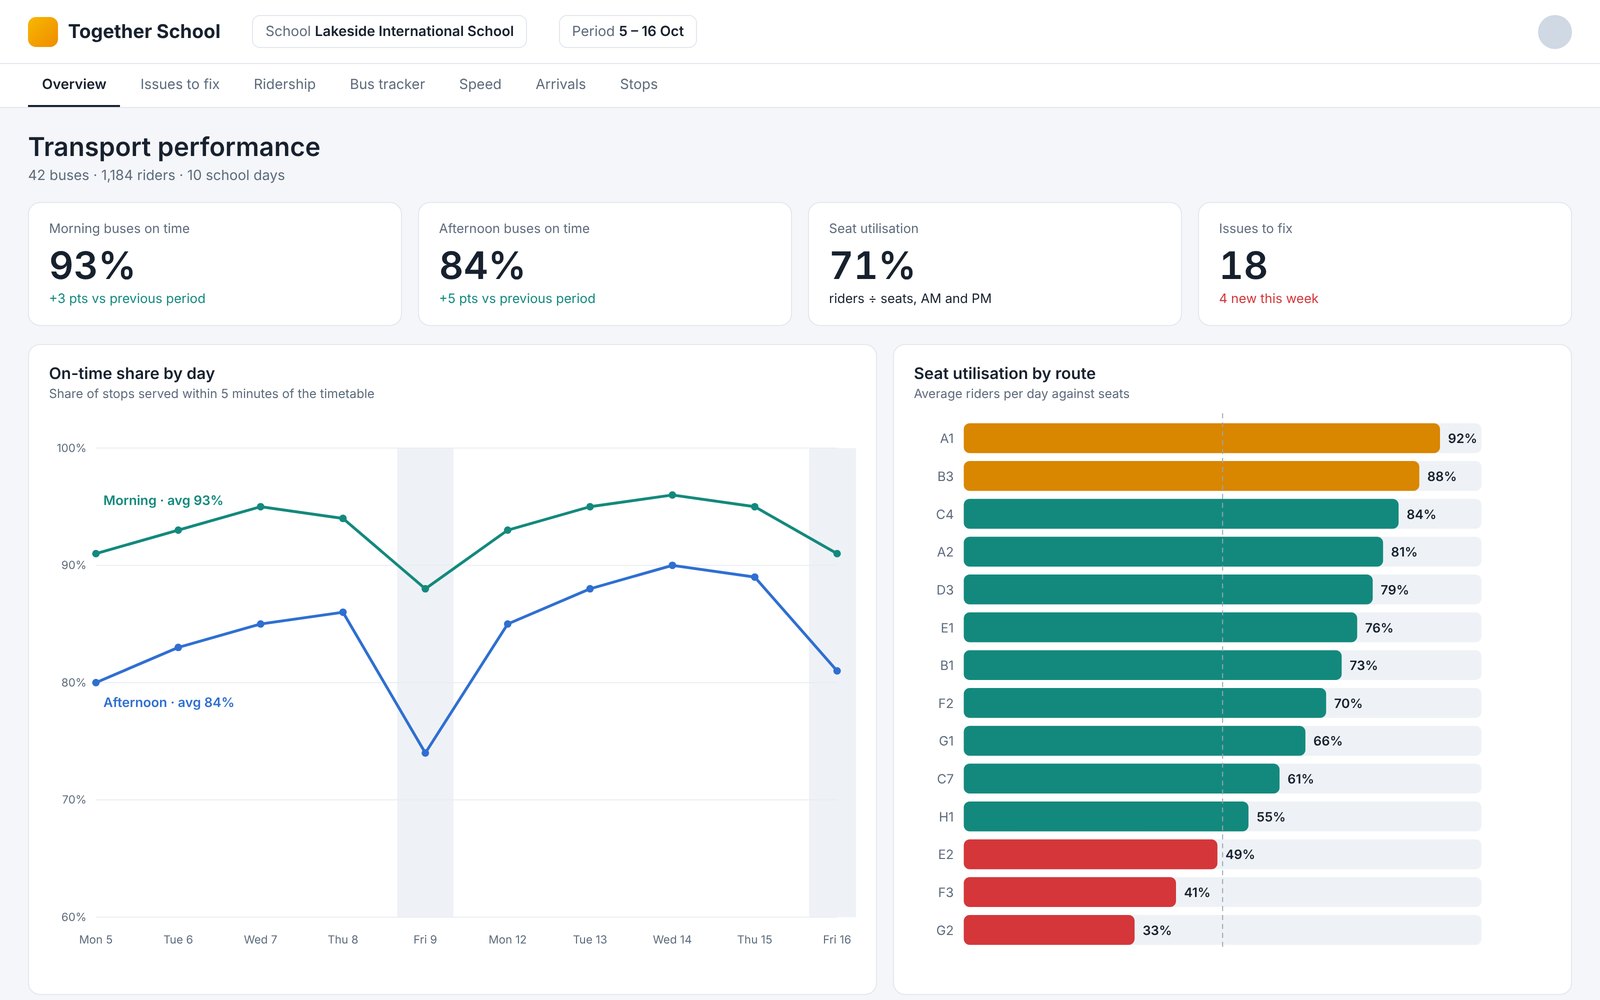
The overview: on-time arrivals, ridership and the routes that need attention, at a glance. Sample data.
What it is
Two data sources you already have. One clear picture.
Route Analytics is a transport management tool for schools. It brings together two things your buses already record, then compares them with your planned routes and stops.
01
Where every bus was
Bus GPS locations throughout every trip, morning and afternoon.
02
When every child tapped
Student tap on and tap off records, so you know who rode and where they boarded.
03
Compared with your plan
Routes, stops, stop order, seats and timings, checked against what actually happened.
The result is a single dashboard that shows what actually happened on every route, on every day, and a ranked list of the issues worth fixing. Transport managers can drill into any route, any stop or any trip, and replay it on a map to see exactly what the bus did.
Why it helps schools
Find problems before parents do.
Act early, not after complaints
Late arrivals, long rides and missed stops are flagged automatically, so your team can act early instead of reacting to complaints.
Know where children really get on
Each stop pin is compared with where children actually tap on, and you are told which pins to move and by how far.
Spot buses stopping where they should not
Unplanned stops near another route's stop are flagged, helping uncover children being moved between buses without the records showing it.
Use your fleet well
See how many children ride each route, how full each bus is, and which routes run well under capacity, so you plan seats and buses with real numbers.
Keep children safe
Speed is checked against the school bus speed limit, overcrowding is measured from children marked on and off, and long rides are highlighted.
Have the evidence in one place
Every flagged issue comes with the date, route, location and a suggested action, so conversations with bus operators are based on facts.
Issues to fix
Everything that needs attention, ranked and ready to act on.
A single list of everything that needs attention, sorted by type and route. Click any issue to see it on a map, or jump straight into the 3D replay at that moment. Every issue comes with a map, the evidence and a suggested action.
Phantom stops and possible child swaps
Wrong pins
Wrong assignments
Wrong stop order
Stops never served
Late to school
Overcrowding
Long rides
Overlapping buses
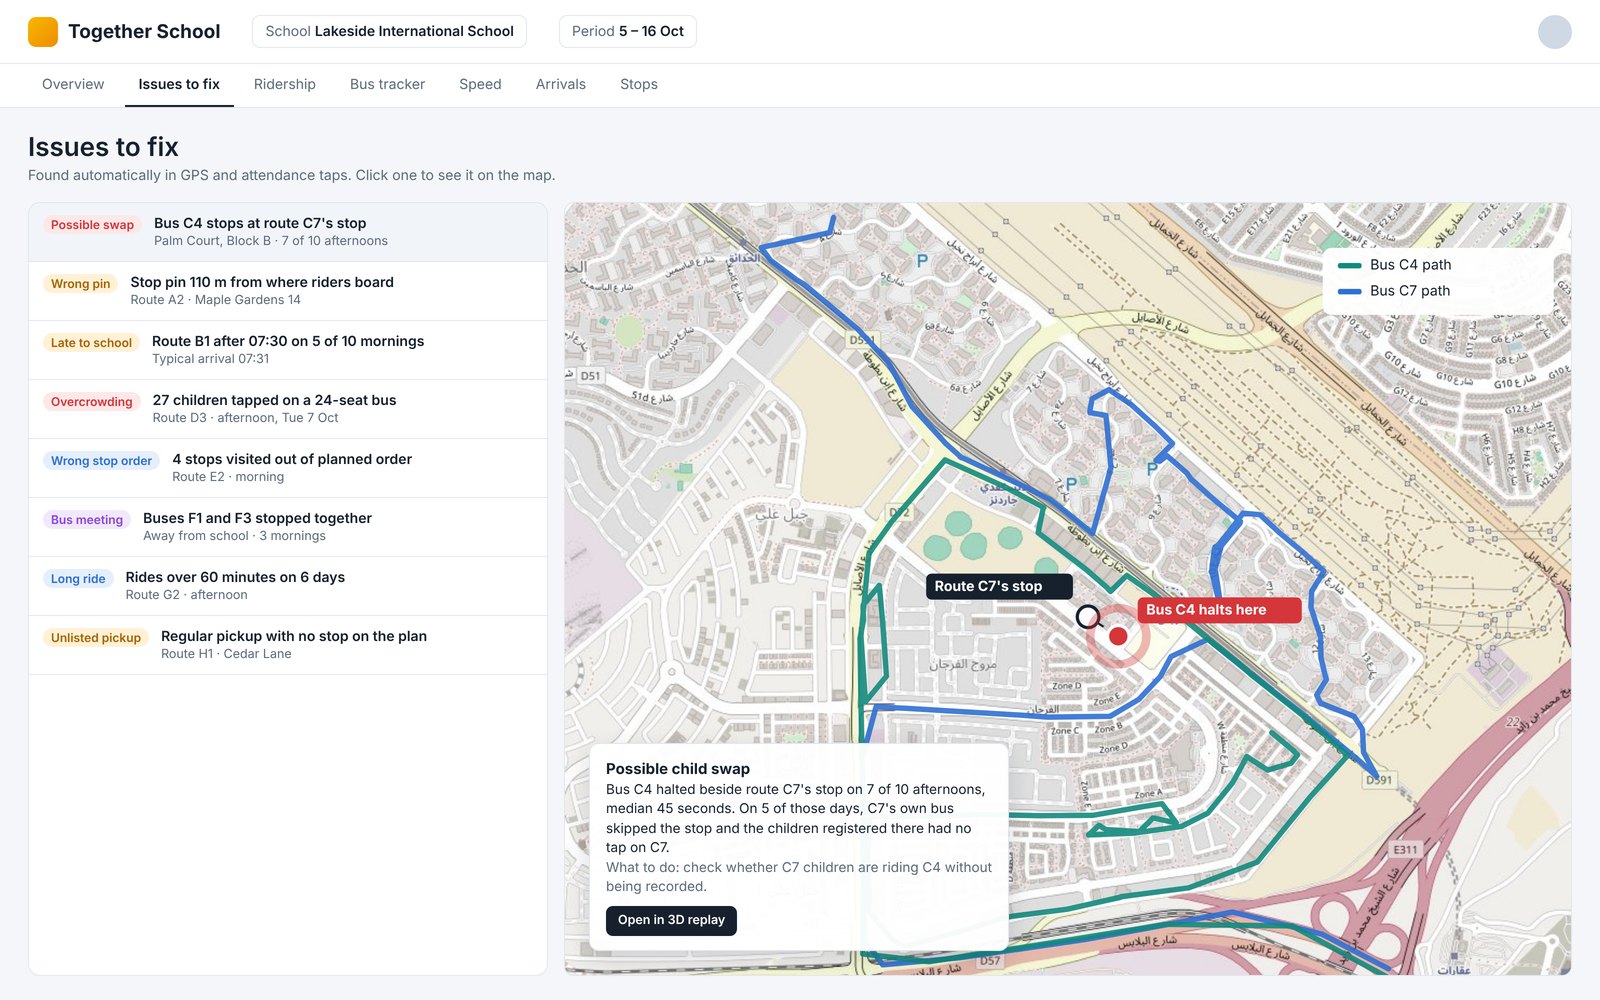
Every issue comes with a map, the evidence and a suggested action. Sample data.
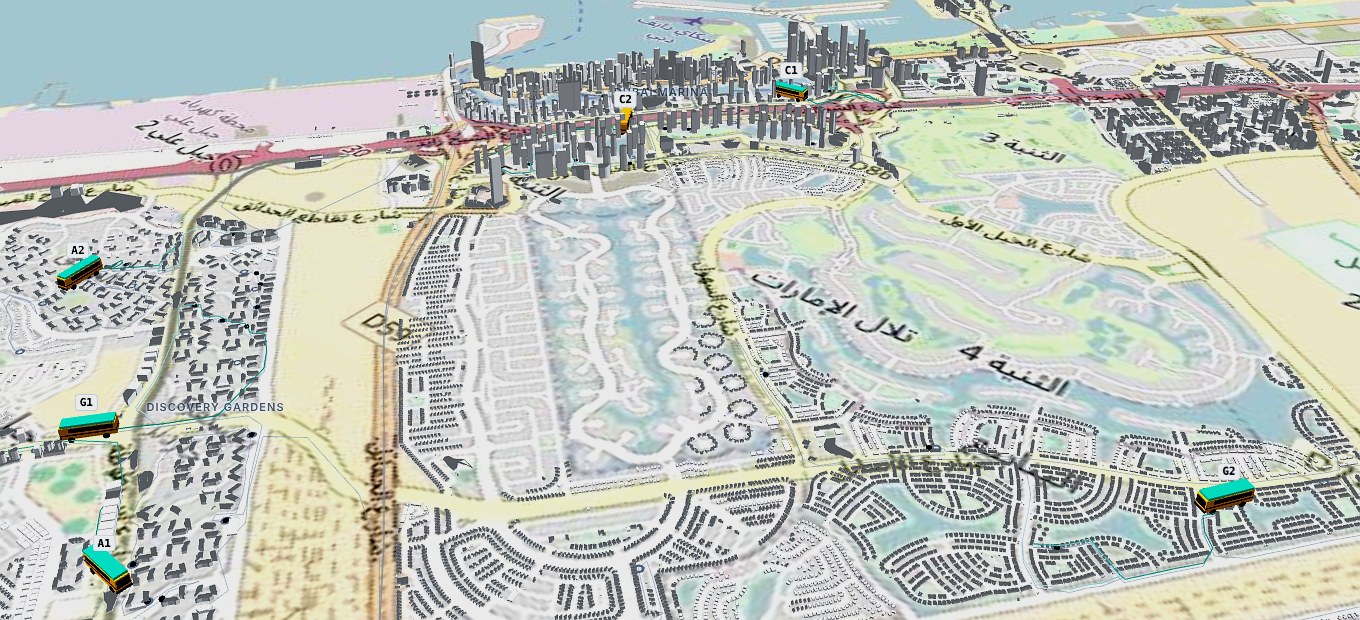
Replay any day in 3D: every bus, every stop, every pickup, coloured by speed. Sample data.
3D trip replay
Watch any run play back on a 3D map of your city.
Each school bus is numbered and coloured by speed, with stops and actual pickup points shown along the way.
Pause
Scrub to any time
Follow a single bus
Fly straight to an issue
Ridership and utilisation
Plan your fleet with confidence.
See how many children board each route every day, the average, and how that compares with the seats available. The dashboard shows the distance and time each child travels, and highlights routes running well below capacity.
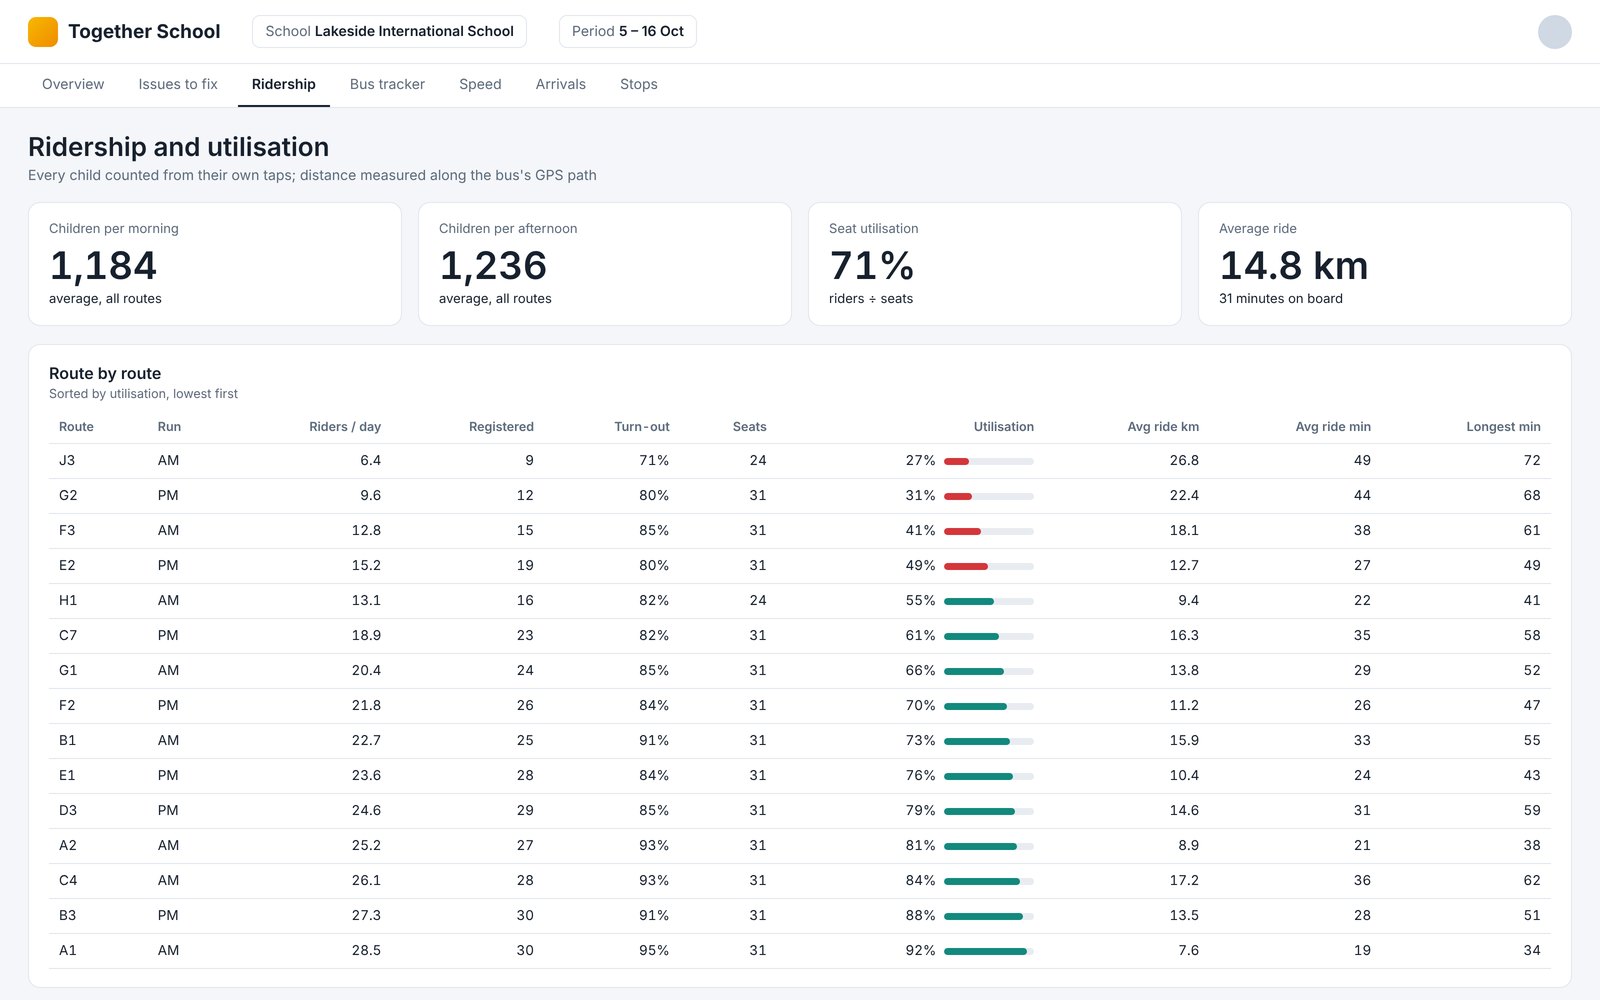
Riders per route, seat utilisation, and distance and time per child. Sample data.
Punctuality and speed
Arrival times at school are tracked for every morning run, so you can see which buses are on time and which are consistently late. Speed is measured along each trip and checked against the school bus speed limit, with any time over the limit recorded.
Stop accuracy
For every stop, the pin on the route plan is compared with where children actually tap on. You see whether the pin is right, should move, or whether children are boarding somewhere else entirely, so your stop list stays accurate.
How it works
From GPS dots to clear decisions.
1
Connect your data
Bus GPS locations and student tap on and tap off records.
2
We compare it with your plan
Routes, stops, stop order, seats and timings.
3
You get the answers
A dashboard, a 3D replay and a ranked list of issues to fix.
One platform
Part of the Together School platform.
Route Analytics works with every other part of Together School, from planning the routes to running them each day.
Transport
Transportation Management
Every route running today on one screen: live map, stops and children, history and alarms.
Learn morePlanning
Route Planning
Plan the whole network, not one route at a time, and keep it right stop by stop.
Learn moreService
Managed Transport Services
Prefer us to run it? We run school transport for you: registration, route planning, live monitoring and compliance. Your school keeps control.
Learn moreSafety
Diversions & Safe Zones
Redirect buses in transit to Safe Zones within minutes when the school can't be reached.
Learn moreActivities
After School Activities
Club bookings reach the buses, so each bus knows who is staying late.
Learn moreDrivers
Bus Staff App
Boarding by NFC card, QR code or a tap, so every child is marked on and off the bus.
Learn moreOnline roundtable · Thursday 3 December 2026
The journey before the bell: a transport health check for school leaders
10:00 to 11:00 CET (13:00 Dubai). Grade your own school across ten areas on our Transport Report Card and compare notes with peers.
See your own routes in Route Analytics.
Get in touch with the Together School team to arrange a walkthrough.
Arrange a walkthroughAll school names, route names and numbers shown are fictional. Map data © OpenStreetMap contributors.